SOURCE: U.S. Department of the Interior, Minerals Management Service, Gulf of Mexico OCS Region

| | COUNTRIES | Geographic.org | GEOLOGY | USA STATISTICS | CHINA STATS | COUNTRY CODES | AIRPORTS | PIPELINES | JOBS | |
| |
|
|
|
| |
|
Deepwater Gulf of Mexico - America's Expanding Frontier
SOURCE: U.S. Department of the Interior, Minerals Management Service, Gulf of Mexico OCS Region | |
|
| |
|
|
LEASING ACTIVITYThe DWRRA encouraged extensive leasing in the deepwater GOM.
Activity slowly increased from 1992 through 1995, but immediately after the
DWRRA was enacted, deepwater leasing activity exploded.
Other factors also contributed to this
activity, including improved 3-D seismic data coverage, several key deepwater discoveries, the
recognition of high deepwater production rates, and the evolution of deepwater development
technologies.
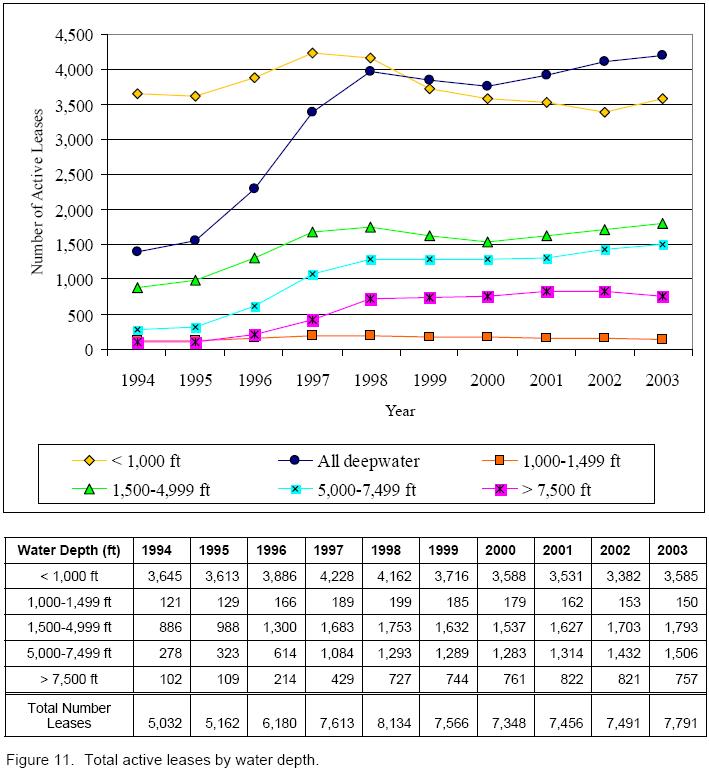
There are about 3,600 active leases in water depths less
than 1,000 ft (305 m), about 150 active leases in 1,000-1,499 ft (305-457 m) of water, about 1,800 active
leases in 1,500-4,999 ft (457-1,524 m) of water, about 1,500 active leases in 5,000-7,499 ft
(1,524-2,286 m) of water, and about 750 active leases in water depths of 7,500 ft (2,286 m) and greater.
The limited number of active leases in the eastern GOM is related to leasing restrictions. In 2001 and
2003, sales were held offshore of Alabama, approximately 100 miles from the coastline, which added
109 active leases. Appendix C provides a chronological listing of all Gulf of Mexico lease offerings
arranged by sale number, location, and date.
Operators contend with numerous obstacles when venturing into the deepwater arena. Figure 12
illustrates natural features and manmade zones that require special considerations for oil and gas
activities. Although the topographic features are located primarily along the shelf break, they may be
obstacles to pipelines from deepwater developments to the shelf infrastructure.
 - Please bookmark this page (add it to your favorites).
Copyright © 1995-2010 ITA all rights reserved. |
Cover and Title Page PREFACE INTRODUCTION BACKGROUND
LEASING DRILLING AND DEVELOPMENT RESERVES AND PRODUCTION SUMMARY AND CONCLUSIONS . . . Feedback 
|