PRODUCTION TRENDS
Seismic acquisition, leasing, bid rejects, drilling, and discoveries�all stepped into deeper waters
with time.
The final piece in the puzzle, production, is no exception.
Figure 59 illustrates the
relative volume of production from each GOM block through time.


Figure 56. BOE added (reserves, known resources, and industry-announced discoveries). (Click the image to enlarge)
Notice the large deepwater
volumes that first appear in 1996 and 1997.
More recent production continues to expand over a
larger area and into deeper waters.
Table 5 shows that the most prolific blocks (on a BOE basis) are
currently in the deepwater GOM.
Table 5
Top 20 Producing Blocks for the Years 2001�2002

Table 5 - Top 20 Producing Blocks for the Years 2001�2002
Figure 60 illustrates the importance of the GOM to the Nation�s energy supply.

Figure 60. Estimated U.S. oil and gas production in 2002.
The GOM supplies
approximately 28 percent of the Nation�s domestic oil and 23 percent of the Nation�s domestic gas
production.
A significant and growing portion of these volumes comes from the deepwater.
Figure 61a illustrates historic trends in oil production.

Figure 61a. Comparison of average annual shallow- and deepwater oil production. (Click the image to enlarge)
Shallow-water oil production rose rapidly in
the 1960�s, peaked in 1971, and has undergone cycles of increase and decline since then.
Since 1997, the shallow-water GOM oil production has steadily declined and, at the end of 2002, was at its
lowest level since 1967.
The deepwater GOM oil production, however, is in the midst of a dramatic
increase similar to that seen in the shallow-water GOM during the 1960�s.
Melancon et al. (2003)
predict that this production surge has not yet peaked. This strong increase in deepwater oil
production more than offsets recent declines in shallow-water oil production.
In 2002, deepwater oil
production accounted for approximately 61 percent of GOM oil production.
Figure 61b shows similar production trends for gas.

Figure 61b. Comparison of average annual shallow- and deepwater gas production. (Click the image to enlarge)
Shallow-water gas production rose sharply
throughout the 1960�s and 1970�s, and then remained relatively stable over the next 15 years before
declining steadily from 1996 through today.
Although the deepwater gas production increase has not
been as dramatic as with oil, the steady increase in deepwater gas production that occurred in the past
few years offsets the shallow-water decline.
Appendix H lists historical GOM oil and gas production
rates. These trends in oil and gas production indicate that the deepwater GOM frontier continues to
expand.
As discussed previously, the Deepwater Royalty Relief Act (DWRRA) had a significant effect on
deepwater leasing and drilling. Numerous projects with royalty relief eligibility have come online in
recent years (table 4), but the impact of the DWRRA on deepwater production is just now beginning
to show.
Figure 62a shows the contribution of Deepwater Royalty Relief (DWRR) oil production to
total �deepwater� GOM oil production, where �deepwater� is defined as 200 m (656 ft), the
minimum water depth for which DWRR incentives are offered, instead of 1,000 ft (305 m), the
definition used elsewhere in this report.

Figure 62a. Contribution of DWRRA oil production to total oil production in water depths greater
than 200 m (656 ft). (Click the image to enlarge)
The amount of oil production subject to royalty suspension
has hovered around 5 percent of the total �deepwater� production since mid-2001.
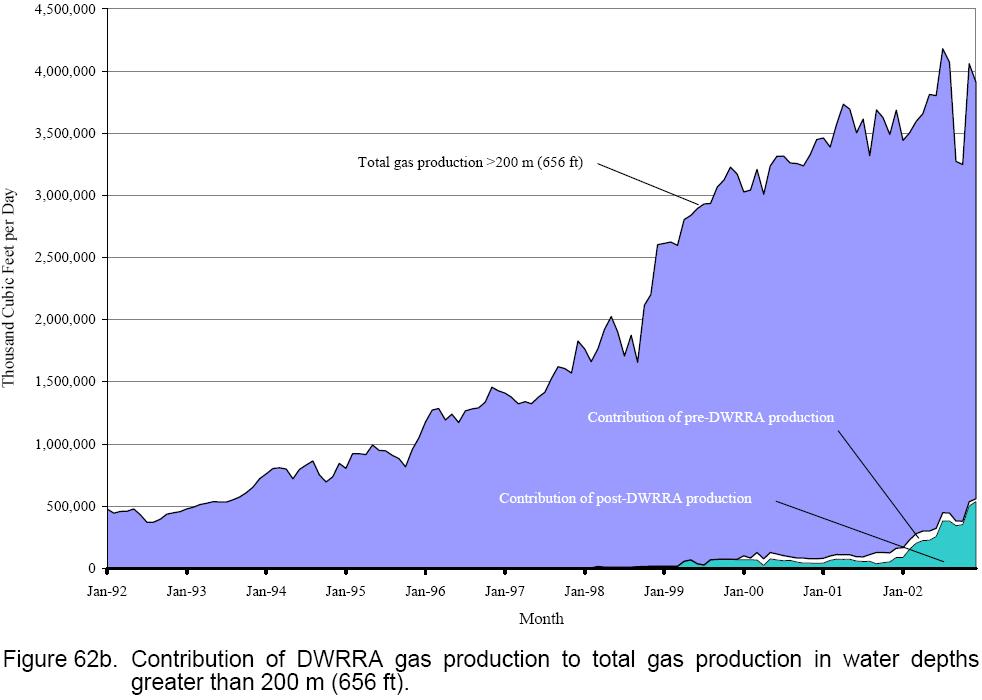
Figure 62b
displays total �deepwater� gas production along with pre-DWRRA and post-DWRRA gas production
subject to royalty relief.

Figure 62b. Contribution of DWRRA gas production to total gas production in water depths
greater than 200 m (656 ft). (Click the image to enlarge)
The volume of natural gas subject to DWRR increased rapidly in 2002,
reaching 14 percent of total �deepwater� production by the end of that year.
Note that pre-DWRRA
production refers to production from leases that have been approved to receive DWRR but were
issued before November 28, 1995.
Post-DWRRA production refers to DWRR production from
leases that were issued after that date.
Approximately 300,000 barrels of oil and 2 billion cubic feet of gas come from deepwater subsea
completions each day.
Subsea completions currently account for about 30 percent of deepwater oil
production and about 50 percent of deepwater gas production.
Figure 63a shows that very little
deepwater oil production came from subsea completions until mid-1995, but by the fall of 1996 that
production had risen to about 20 percent.

Figure 63a. Contributions from subsea completions toward total deepwater oil production. (Click the image to enlarge)
Since 2000, subsea oil production has increased slightly,
whereas total deepwater oil production has increased dramatically.
Deepwater gas production from
subsea completions began in early 1993, and by mid-1994 they accounted for over 40 percent of
deepwater GOM gas production (Figure 63b).

Figure 63b. Contributions from subsea completions toward total deepwater gas production. (Click the image to enlarge)
Gas production from subsea completions increased
from 1996 through 1999, remained constant in 2000, and increased rapidly after 2000.
 - Please bookmark this page (add it to your favorites).
Copyright © 1995-2010 ITA all rights reserved.
|