PRODUCTION RATES
High well production rates have been a driving force behind the success of deepwater operations.
Figure 67a illustrates the highest deepwater oil production rates (monthly production divided by
actual production days).

Figure 67a. Maximum production rates for a single well within each water-depth category for
deepwater oil production. (Click the image to enlarge)
For example, a well within Shell�s Bullwinkle field produced about
5,000 BOPD in 1992. In 1994, a well within Shell�s Auger field set a record, producing about
10,000 BOPD.
From 1994 through mid-1999, maximum deepwater oil production rates continued to
climb, especially in water depths between 1,500 and 4,999 ft (457 and 1,524 m).
Horn Mountain
came on line in early 2002 in 5,400 ft (1,646 m) water depth with a single well maximum rate of
more than 30,000 BOPD
The deepest production is currently held by Camden Hills in 7,216 ft
(2,199 m) water depth.
Figure 67b shows maximum production rates for gas.

Figure 67b. Maximum production rates for a single well within each water-depth category for
deepwater gas production. (Click the image to enlarge)
These rates hovered around 25 MMCFPD
until a well in Shell�s Popeye field raised the deepwater production record to over 100 MMCFPD in
1996. Since then, the deepwater has yielded even higher maximum production rates.
In 1997, Shell�s Mensa field (5,379 ft [1,640 m] water depth) showed the excellent potential for deepwater
production rates beyond the 5,000 ft (1,524 m) water depth. The record daily oil and gas production
rates (for a single well) are 41,532 BOPD (Troika) and 145 MMCFPD (Mica).
Figure 68a shows that the average deepwater oil completion currently produces at 20 times the rate
of the average shallow water (less than 1,000 ft [305 m]) oil completion.

Figure 68a. Average production rates for shallow-water and deepwater oil well completions. (Click the image to enlarge)
The average deepwater gas
completion currently produces at 8 times the rate of the average shallow-water gas completion
(figure 68b).

Figure 68b. Average production rates for shallow-water and deepwater gas well completions. (Click the image to enlarge)
Deepwater oil production rates increased rapidly from 1996 through 2000 and
remained steady since that time.
Deepwater gas production rates rose from 1996 to mid-1997 and
then stabilized at the current high rates.
Two trends are readily apparent in figures 69a-b.

Figure 69a. Deepwater oil production profiles (oil wells coming onstream between 1992 and
2002). (Click the image to enlarge)

Figure 69b. Deepwater gas production profiles (gas wells coming onstream between 1992 and
2002). (Click the image to enlarge)
First, average oil and gas production rates per well
are increasing and, secondly, production rates are declining from their peaks more rapidly in recent
years.
These figures plot monthly average oil and gas production rates for all wells completed in a
specific year.
For example, in figure 69a, the 1992 line represents oil well production for oil wells
completed in 1992 divided by the number of oil wells completed in that year.
The 1992 line tracks
production from these completions in successive years.
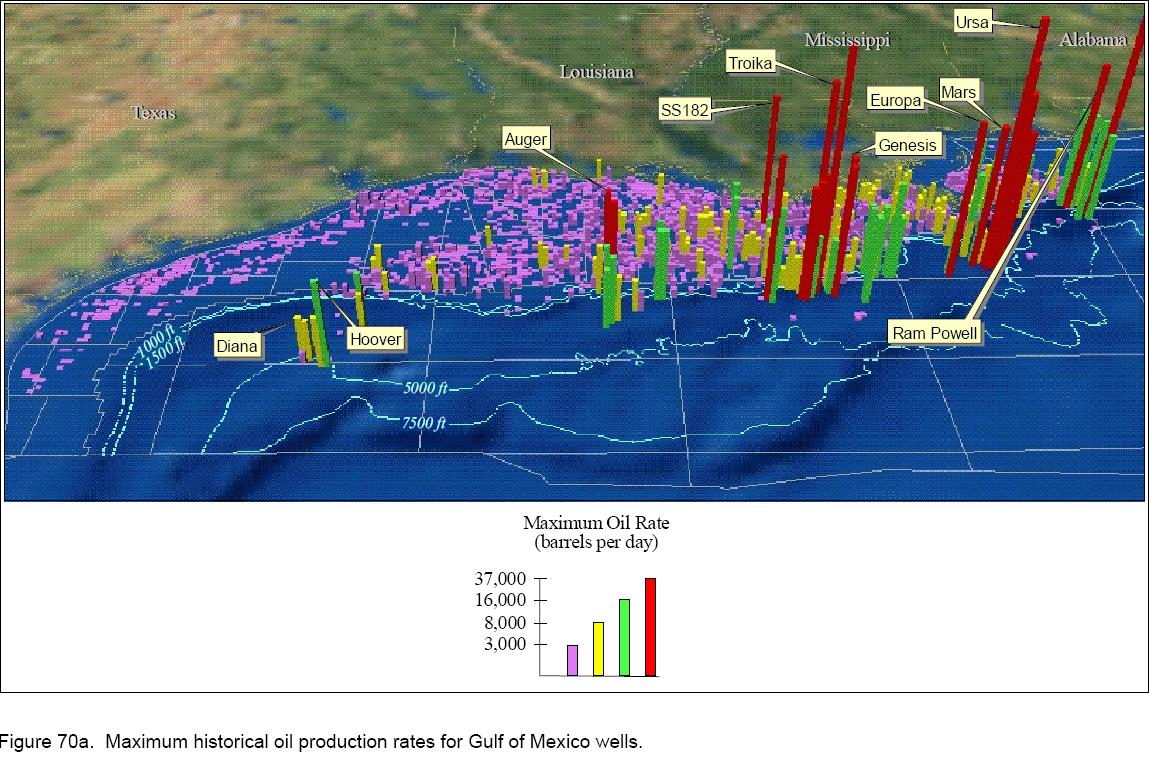
Figures 70a (oil) and 70b (gas) compare maximum historical production rates for each lease in the
GOM, i.e., the well with the highest historical production rate is shown for each lease.

Figure 70a. Maximum historical oil production rates for Gulf of Mexico wells. (Click the image to enlarge)

Figure 70b. Maximum historical gas production rates for Gulf of Mexico wells. (Click the image to enlarge)
These maps show that many deepwater fields produce at some of the highest rates encountered in the GOM.
Figure 70a also shows that maximum oil rates were significantly higher off the southeast Louisiana
coast than off the Texas coast.
Figure 70b illustrates the high deepwater gas production rates relative
to the rest of the GOM.
Note also the excellent production rates from the Norphlet trend (off the
Alabama coast) and the Corsair trend (off the Texas coast).
 - Please bookmark this page (add it to your favorites).
Copyright © 1995-2010 ITA all rights reserved.
|